Sometimes I find it beyond tedious to do something with all of the (behavioral, educational, alternate assessment related) data I have to take. Sure I use it for my quarterly progress reports but I don't often take the time to make graphs because it seems so time consuming.
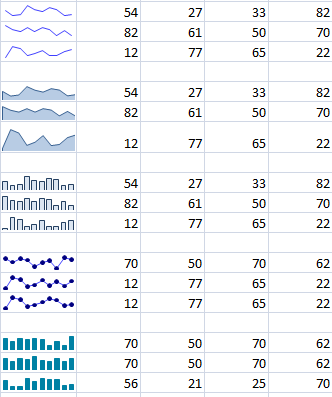
This might all change with Tiny Graphs. Tiny Graphs makes mini line, area or bar graphs for every row in an excel chart. So easy! Just type your data across in a row and voila a graph appears!
You could even have all of the data for every goal and objective of an IEP on one page! So cool!
Nod to REMC Ramblings for the link.


No comments:
Post a Comment
Comments and respectful discussion are welcome and encouraged! No advertisements or spamming.