First and foremost I am making an assumption that you are taking data, but of course you are, right? If for no other reason than more of you must participate in some kind of alternative assessment procedure and need data to get through that. Today I spent some time looking at the options for free charting and graphing software. In the end I used Microsoft word (2007 as seen below). However I will pass on the set of links below for you to explore. Had I had more time I may well have used one of these free programs. For the record I use data charts from Therasimplicity to collect data.
Showing posts with label graphing. Show all posts
Showing posts with label graphing. Show all posts
Tuesday, October 21, 2008
Monday, January 7, 2008
Quick and Easy Data Graphing
Sometimes I find it beyond tedious to do something with all of the (behavioral, educational, alternate assessment related) data I have to take. Sure I use it for my quarterly progress reports but I don't often take the time to make graphs because it seems so time consuming.
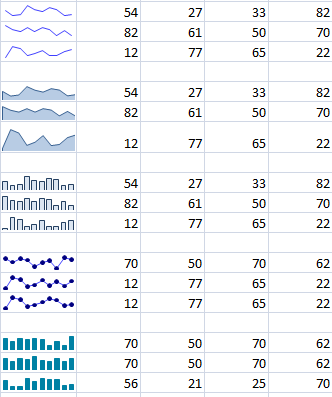
This might all change with Tiny Graphs. Tiny Graphs makes mini line, area or bar graphs for every row in an excel chart. So easy! Just type your data across in a row and voila a graph appears!
You could even have all of the data for every goal and objective of an IEP on one page! So cool!
Nod to REMC Ramblings for the link.
Subscribe to:
Posts (Atom)
Contact Me at:
Visit our advertisers:


